The unsung heroes of the IntelliJ Community repository
Inspired by a recent post, where someone analysed the commit times of popular developers, I thought it might be interesting to see something similar for the IntelliJ Community repository. Therefore, the question for today is: Who are the unsung heroes who work on the IntelliJ Community code base?
Cleaning data
For the following analysis, I fondled with almost 250k commits that I inspected using Wolfram Mathematica.
Using git log to extract all commits (not including merge commits), I obtained only the author name, the email address
and the exact date of the commit.
The biggest hurdle was to assign a commit to the correct developer because as it turns out, people like to use different
names and email addresses over time or on different machines.
For instance, Dmitry Jemerov, commonly known as yole, used four separate email addresses in his commits.
Additionally, I found many funny typos in the provided email addresses. While you might think that many are working for JetBrains, the truth is that we have quite some developers who seem to work for JetBrians, JebTrains or even JebRains. Some even misspelt their own names. Yes, I’m looking at you Dmirtiy :)
An overview
First, I wanted to look at the top-performer regarding the number of commits. Here is a pie-chart showing the portion of commits for the top 15 developers. I find it quite impressive that the top four developers have as many commits as the remaining 11 people in this chart.
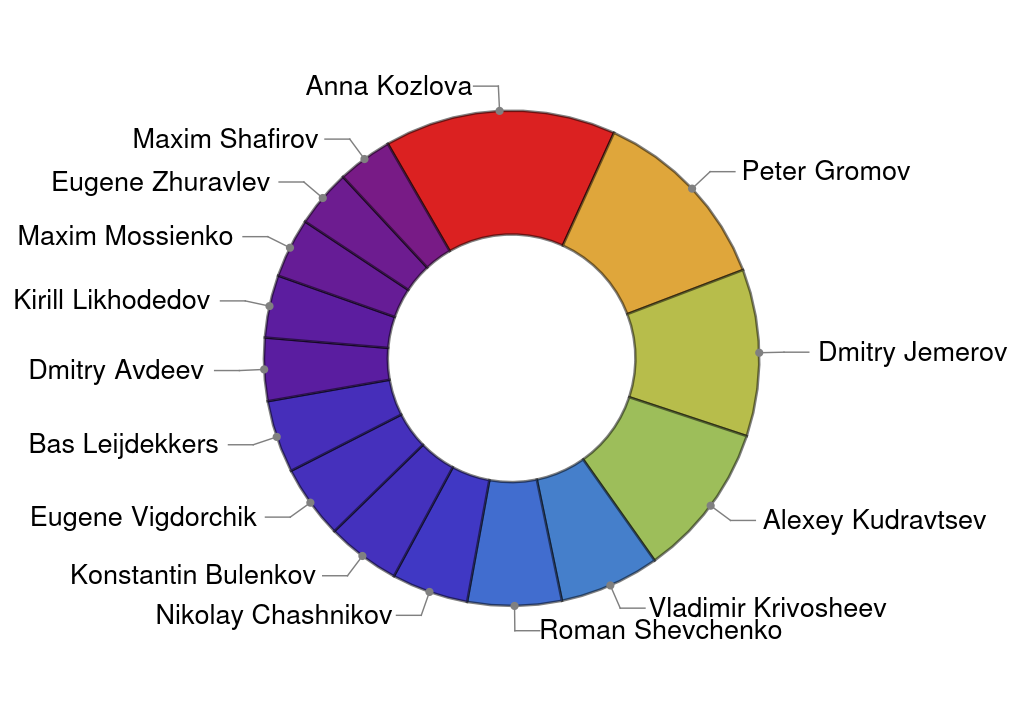
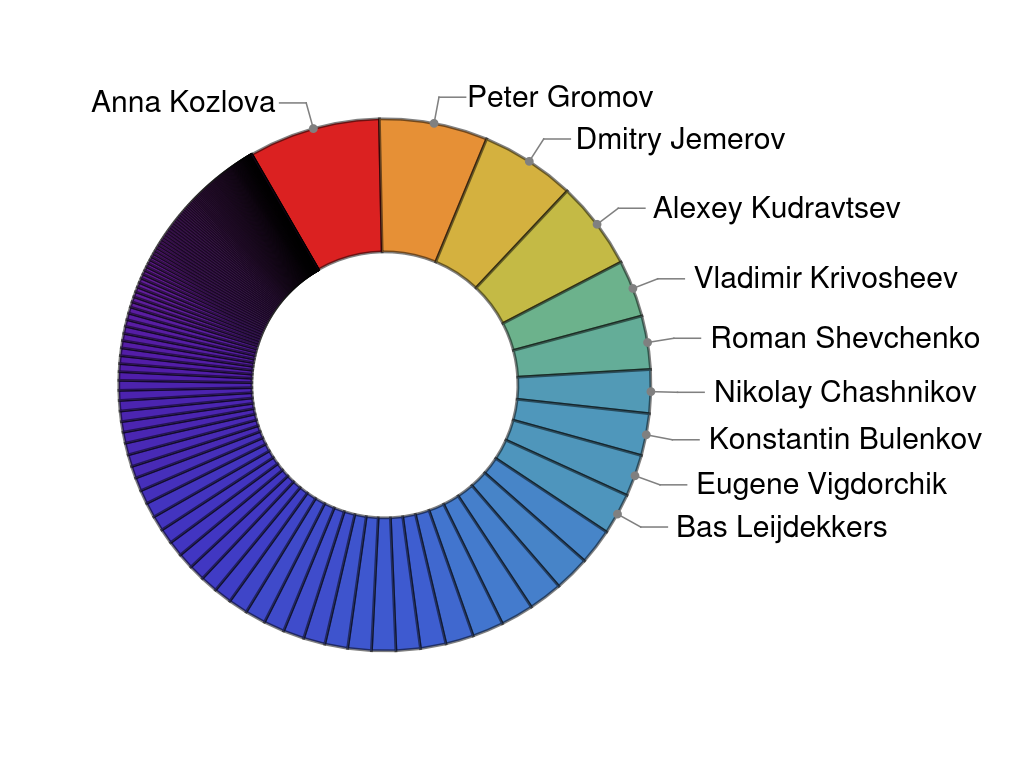
This becomes even more impressive when we look at a similar chart for the top 200 developers. The first ten developers hold over 40% of commits of all 200 developers. To give you some numbers: For Anna, Peter and Dmitry, I counted 19.111 (8%), 15.694 (6.5%), and 13.764 (5.7%) of commits respectively, while the total number of commits for these 200 devs is 238.733. And as a comparison, the 200th developer made “only” 26 (0.01%) commits in total.
However, we should not forget that all people are working hard on the IntelliJ code and that the number of commits says not much about how complicated it was to implement a feature or fix a bug. To give credit to more of these awesome developers, we can create a word-cloud and encode their contribution in font-size and colouring. Below, are the top 400 developers arranged in a word-cloud and pressed into the (old) IntelliJ logo.

Case study
Particularly interesting was the time of the commits because it somewhat reflects the working-hours of the developers. For specific people, we can collect the time of all their commits and calculate a histogram that represents an average day. This gives a good impression of how they have been working over the years.
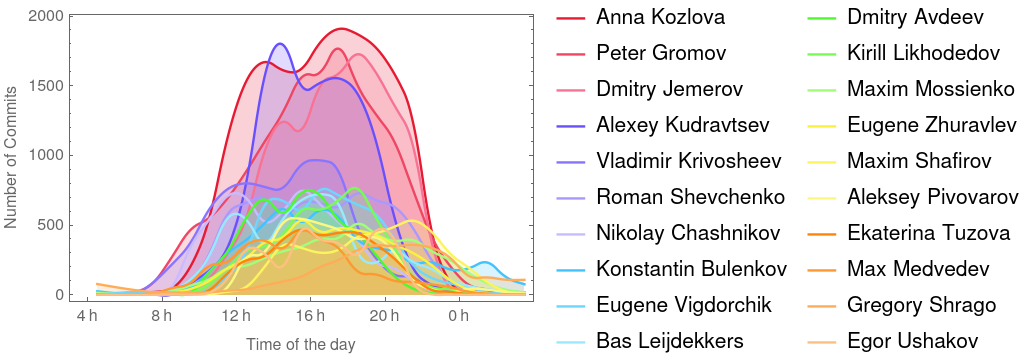
It appears that most of the action happens between 8 am and midnight and that many of the shown developers regularly commit throughout these hours. There are some difference visible but at least in the 20 people shown, we cannot find a real night-owl, who has its peak after midnight. It would be interesting to know if developers indeed work for so many hours on a regular day, but unfortunately this cannot be concluded from this graph since it is a sum of all days.
Let’s stalk the top performer, Anna, a bit more and look at her week by separating the days into different curves.
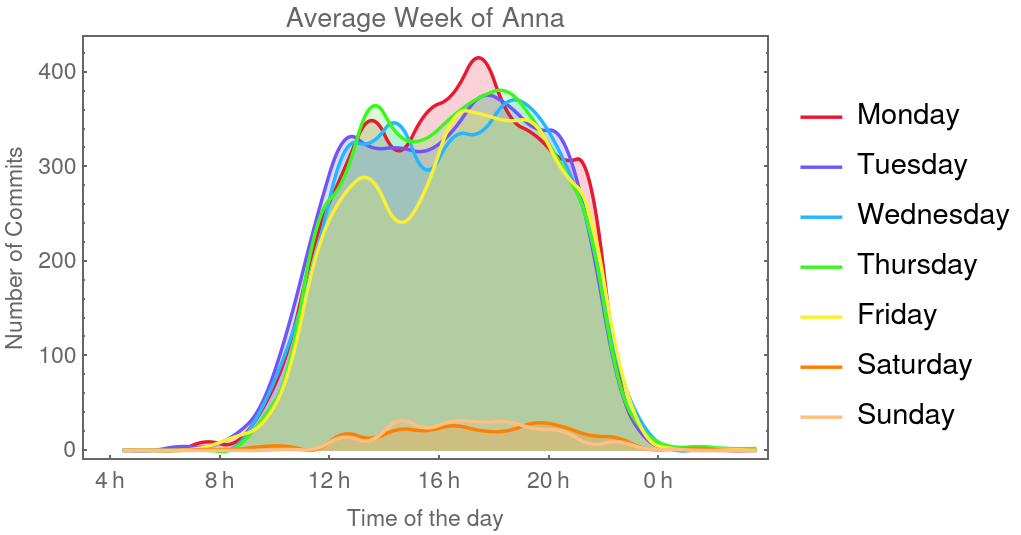
The first thing we notice is that Monday is more productive than Friday. Secondly, there is a distinct separation of, what I assume is, before and after lunch in each day. This is visible in a drop of activity at around 14-15 pm. Furthermore, the afternoon period is longer, and she regularly commits until about 9-10pm before the curves drop rapidly. Her Wednesday is interesting because the lunch break is shifted one hour into the afternoon, and, finally, it is good to see that weekends are almost free from commits. Other than that she has quite regular schedule: Starting not too early and warming up in the first hours, make a lunch break and burn like a SpaceX rocket through the afternoon and evening. Impressive.
One conclusion we can draw from this is that if you want to grab a coffee with Anna, then Friday at 3 pm is your sweet spot. To see these kinds of patterns over such a long period is astounding. Let me remind you; this histogram averages a stretch of over 14 years because Anna’s first recorded commit was on the 15th of November in 2004.
Timezones
We can also look over the distribution of all commits regarding the timezone. You need to put on your rubber gloves for this plot because timezones are weird. In Germany, we have daylight saving time (DST), which means that I will commit at UTC+1 during the winter and UTC+2 during the summer. Other countries don’t have this, or even worse, they had it and decided they don’t like DST any more. Additionally, since there is such a vast difference in the number of commits from particular timezones, the following plot is on a log-scale. So keep in mind that the red bars are much, much higher than the others.
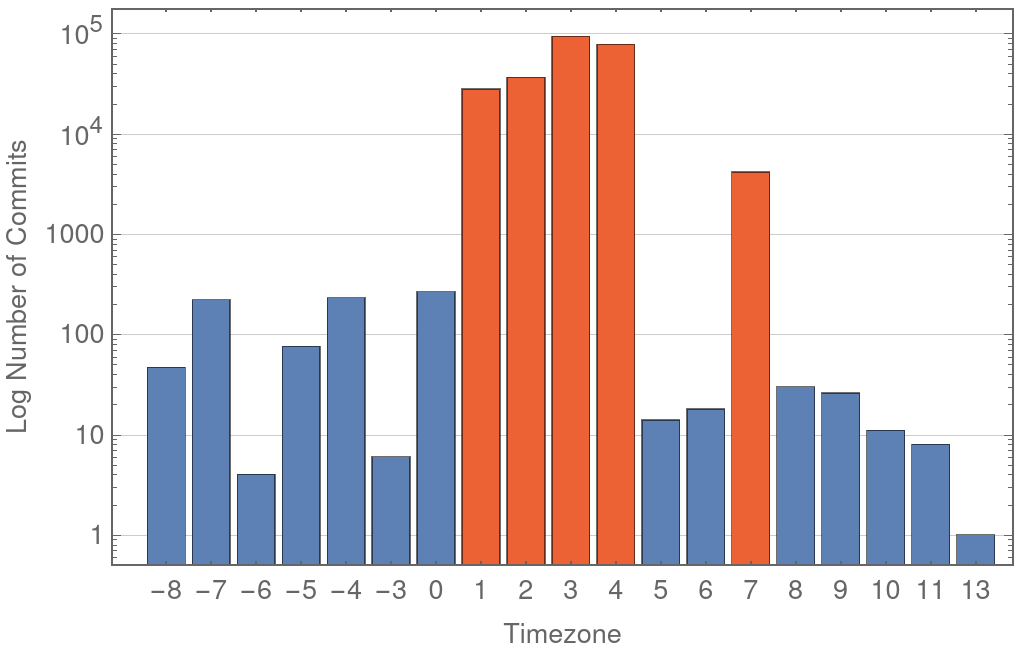
Taking into account that JetBrains has offices in Prague, Saint Petersburg, Moscow, Munich, Boston and Novosibirsk, we can explain above graph to a reasonable degree. The timezones 1-4 (although I’m not entirely sure where the 4 comes from) are most likely from the offices in Prague, Saint Petersburg, Moscow, and Munich. Novosibirsk might contribute to the big spike in timezone 7 and it seems Boston, with UTC-5/4 is a bit underrepresented. Please don’t draw too many conclusions from this graph. It’s unclear, e.g. if and how many people are working remotely and are not located in one of the offices. The only thing we can conclude is that the timezones 1-4 and 7 contribute 99.6% of all commits.
Are there contributors outside of JetBrains?
JetBrains employees work hard on the open-source IntelliJ Community repository and provide an insane number of commits.
From all people who commit to the repository, only 46% have an @jetbrains in their email.
However, these people account for about 94% of all commits.
We can visualize this by a simple chart that uses the list of developers sorted by their commit-count and color them differently. That gives us an overview and shows that in the top-100, JetBrains people pretty much lead the field and there seem to be only a handful of people that don’t have a JetBrains email.
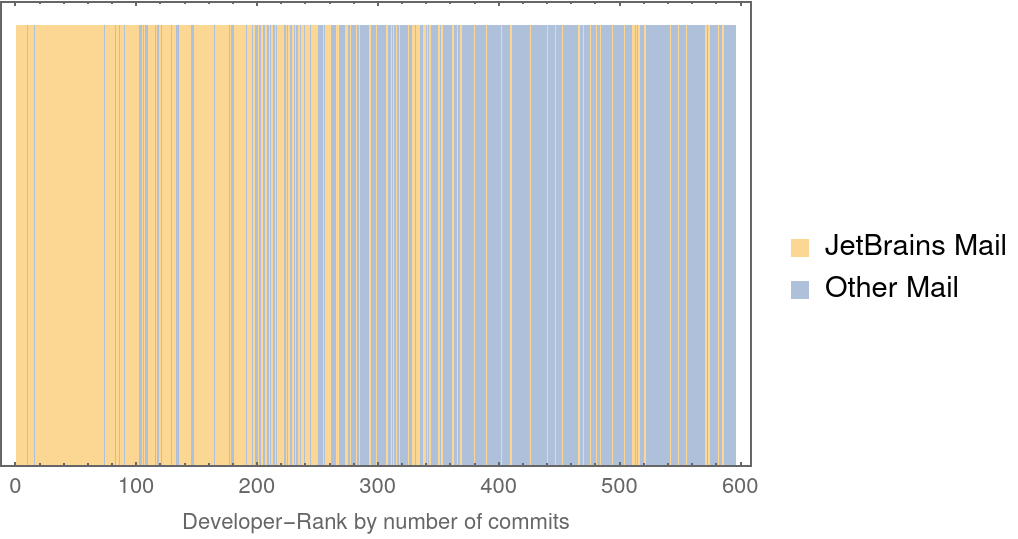
Nevertheless, two people stand out: Bas Leijdekkers and Aleksey Pivovarov. These two were the only ones I could identify in the top-50 who don’t seem to work for Jetbrains and still have an incredible commit-count. Bas is with 5987 commits on place 10 of the hitlist, and you have already seen his name in the first two plots. Aleksey is on position 16 with 4053 commits, and he almost made it into the very first top-15 graph.
Update: I learned that Bas and Aleksey work for JetBrains. When writing the article, I checked their LinkedIn profiles and since there was also no trace of JetBrains, I assumed they might be independent. Turns out I was wrong :)
The takeaway from this is that, although JetBrains does the significant workload, there are many other contributors who spend their time improving the code. Even if they only have some commits, it shows that the community cares and is deeply involved in the project. I believe we are more than fortunate that JetBrains provides an environment where employees regularly contribute to the open-source parts of IntelliJ products.
Final Note
I looked at the data in detail to collect commits from users who had different email and user-name settings but still were the same person. Nevertheless, I’m sure there are still commits that belong to one user and were counted separately in my analysis. Therefore, take this analysis with a knowing smile and remember that it is an estimate.